System Design
System Architecture
Chanel's automated reports generation system is a fully integrated solution which consists of an interactive user interface, an authorization system, automated data workflows, a reporting layer, centralised data storage, and seamless integration with the original data source.
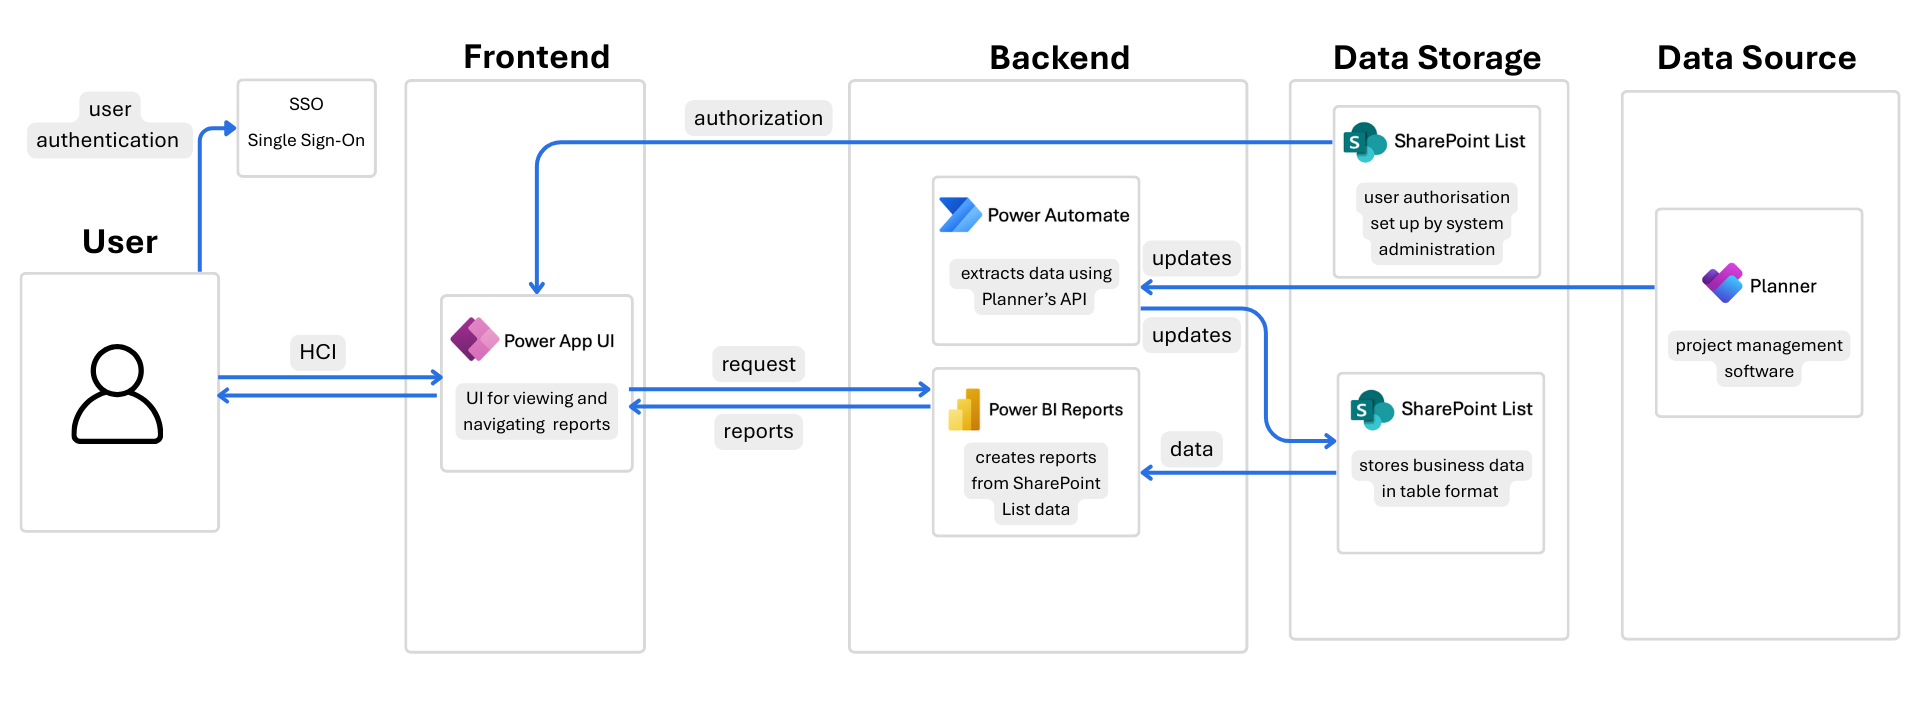
Frontend
User Interface: The user interface implemented using Power Apps provides users an intuitive and simple way to interact with the reports.

Power App key functionalities:
- Embeds interactive Power BI report dashboards for Individual and Team reports.
- Enables users to apply custom filters to the embedded Power BI dashboards.
- Includes a navigation menu for switching between Team Reports, Individual Reports, and the Profile page.
- Responsive design that automatically adapts to various screen sizes (tablet and desktop).
- Role-Based Access Control (RBAC) to restrict report access based on user roles pre-defined in the SharePoint List by system administrators.
- Designed to be extendable: future versions can integrate Power Apps AI Builder to support features such as form processing or intelligent Q&A on reports.
Backend
Reports Generation: The report dashboards are implemented in Power BI.

Power BI key functionalities:
- Allows the creation of interactive dashboards for Individual and Team reports.
- Power Query: no-code data cleaning and transformation.
- DAX Formulas: custom metrics and calculations.
- Connects directly to the SharePoint List (used as the data source for report generation) and allows direct querying.
- Performs scheduled daily data refreshes to automatically update datasets and report dashboards.
- Supports dynamic data exploration with drill-down and drill-through capabilities.
- Enables time-based filtering by year, quarter, and month across all reports.
Data Automation: Power Automate serves as the core data automation tool.
Power Automate key functionalities:
- Extracting data from Microsoft Planner.
- Processing and standardising data before storing it in SharePoint List.
- Automated flows scheduled to run daily for consistent data updates.
- Built-in error handling: logs failed operations and retries data fetching when necessary.
- Enables no-code workflows to automate processes across integrated applications (an extandable feature).
Data Storage
Data Storage: SharePoint List stores the data extracted by Power Automate from Microsoft Planner and another List is used to set up the Role-Based Access Control (RBAC) for reports access within Power Apps.

SharePoint Lists key functionalities:
- Provides structured centralised data storage in a table format (rows and columns).
- Allows Power BI to set a direct connection for data querying for reports generation.
- Used to set up the Role-Based Access Control (RBAC) for Power Apps.
Data Source
Microsoft Planner is the current project management software being used by Chanel's Creative Department. Our system is designed to integrate seamlessly with this existing platform, ensuring minimal disruption and maximum compatibility with the team's current workflow.

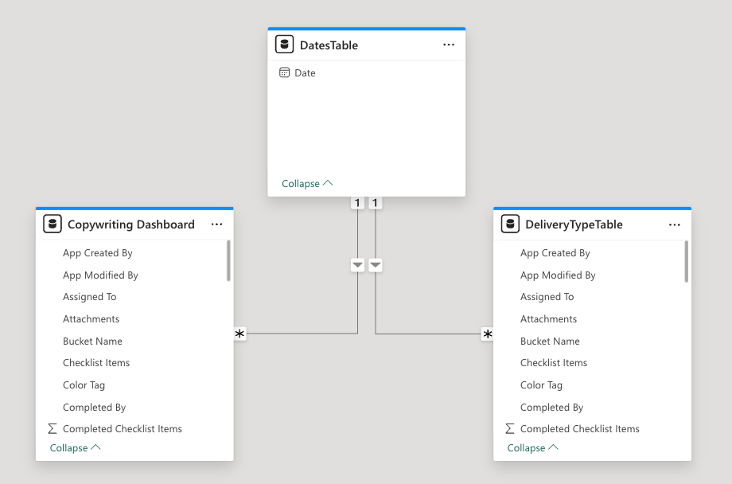
Power BI Entity Relationships Diagram
We want to ensure consistent and synchronised filtering across all visuals on the Power BI dashboards - by year, quarter, month, and day. To achieve this, we implemented table relationships within the Power BI data model.
The DateTable table serves as the central reference point for all time-based filtering.
One-to-many relationships were established between the Date column in the DateTable and the Due Date columns in relevant tables, such as:
- Copywriting Dashboard table
- DeliveryTypeTable
Best Practises Utilised
Scalability & Maintainability:
- Used modular workflows in Power Automate (separate data extraction, transformation, and loading).
- Documented Power Automate, Power BI and Power Apps for future modifications and reproducibility of our system.
User Experience:
- Ensured Power Apps is an intuitive and user-friendly UI with clear navigation.
- Implemented filtering and drill-through features in Power BI.
- Implemented a responsive design that automatically adapts to various screen sizes (tablet and desktop).
Data governance & Security features:
- Implemented row-level security (RLS) in Power Apps for role-based access to Team and Individual reports.
Performance optimization:
- To optimise performance and reduce load times, incremental refresh was implemented in Power Automate. Instead of retrieving the entire dataset from Microsoft Planner during each flow run, the system intelligently detects and loads only newly added or updated data, significantly improving efficiency.
- Optimised DAX measures in Power BI to improve performance of the reports.